Overview
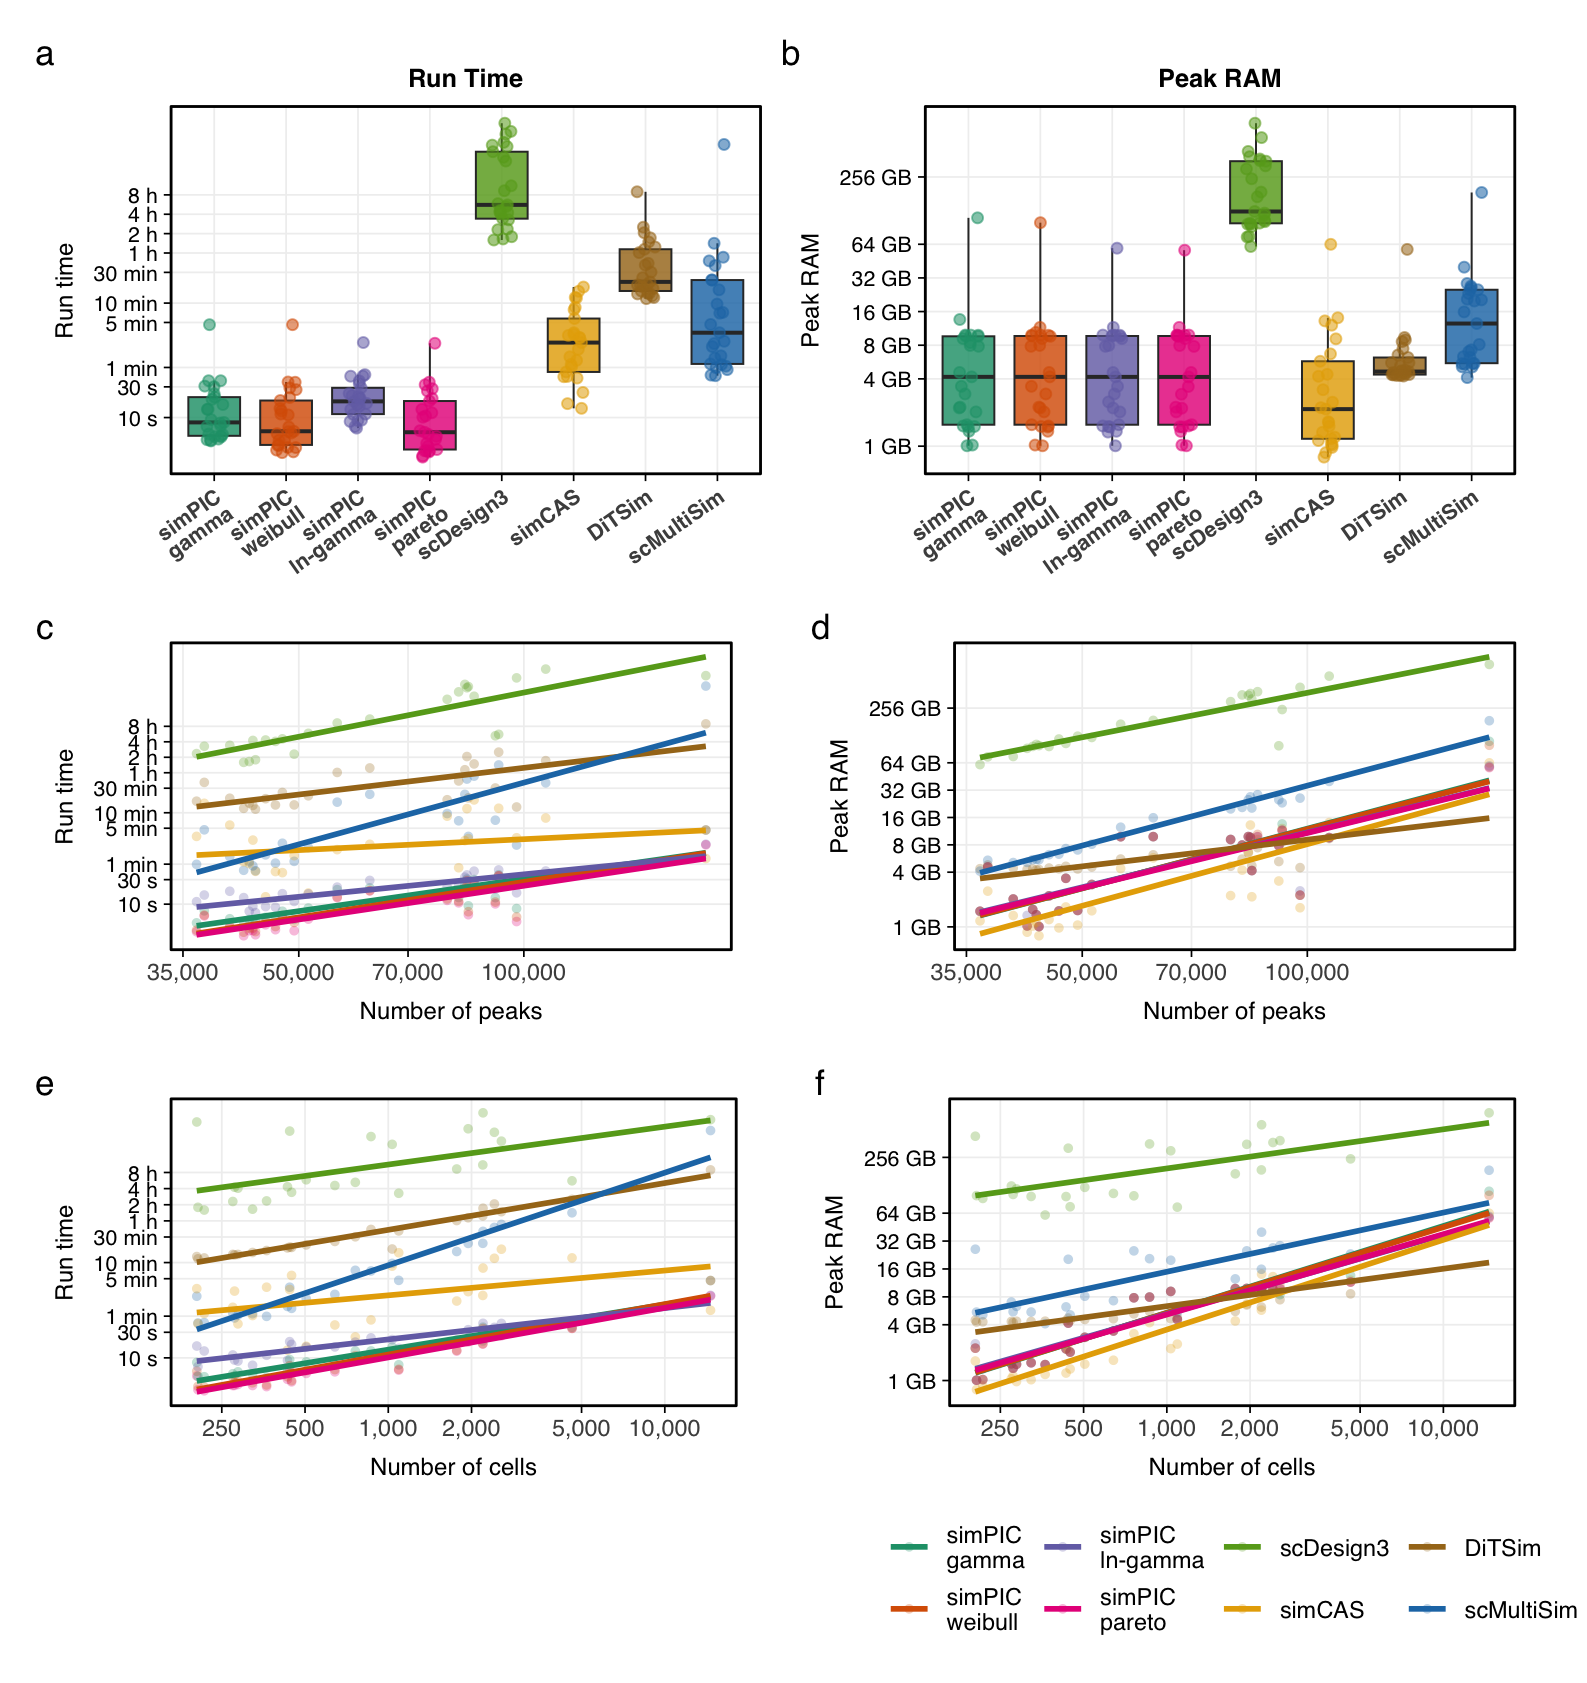
This document reproduces the manuscript Figure 5 runtime and memory panels from the processed benchmarking table provided with this repository. The figure compares simulator runtime and peak RAM across the 25 cell types used in the benchmark and shows how both quantities scale with the number of cells and peaks.
All inputs used below are stored in data/figure5.
The code prints the plots in the knitted document and does not save any figures or intermediate files.
Load Data
Show code
runtime_memory <- read_tsv(
  "data/figure5/Final_RunTime_Memory_with_ncells_25celltypes.txt",
  show_col_types = FALSE
) |>
  rename(
    CellType = Celltype,
    Method = Tool
  ) |>
  mutate(
    Dataset = as.factor(Dataset),
    CellType = as.factor(CellType),
    Method = trimws(as.character(Method)),
    Method = recode(
      Method,
      "simPIC-lngamma" = "simPIC-ln-gamma",
      "simPIC-Pareto" = "simPIC_pareto"
    ),
    CelltypeID = factor(interaction(Dataset, CellType, sep = " | ", drop = TRUE)),
    PeakRAM_Mb = as.numeric(PeakRAM_Mb),
    RunTime_sec = as.numeric(RunTime_sec),
    nCells = as.numeric(nCells),
    nPeaks = as.numeric(nPeaks)
  )
Plot Settings
Show code
method_order <- c(
  "simPIC-gamma",
  "simPIC-weibull",
  "simPIC-ln-gamma",
  "simPIC_pareto",
  "scDesign3",
  "simCAS",
  "DiTSim",
  "scMultiSim"
)

method_cols <- c(
  "simPIC-gamma" = "#1B9E77",
  "simPIC-weibull" = "#D95F02",
  "simPIC-ln-gamma" = "#7570B3",
  "simPIC_pareto" = "#E7298A",
  "scDesign3" = "#66A61E",
  "simCAS" = "#E6AB02",
  "DiTSim" = "#A6761D",
  "scMultiSim" = "#1F78B4"
)

method_labels <- c(
  "simPIC-gamma" = "simPIC\ngamma",
  "simPIC-weibull" = "simPIC\nweibull",
  "simPIC-ln-gamma" = "simPIC\nln-gamma",
  "simPIC_pareto" = "simPIC\npareto",
  "scDesign3" = "scDesign3",
  "simCAS" = "simCAS",
  "DiTSim" = "DiTSim",
  "scMultiSim" = "scMultiSim"
)

pub_theme <- theme_bw(base_size = 11, base_family = "Helvetica") +
  theme(
    panel.grid.major = element_line(colour = "grey94", linewidth = 0.3),
    panel.grid.minor = element_blank(),
    panel.border = element_rect(colour = "black", linewidth = 0.5),
    axis.title.x = element_text(size = 9, colour = "black", margin = margin(t = 6)),
    axis.title.y = element_text(size = 9, colour = "black", margin = margin(r = 6)),
    axis.text.y = element_text(size = 8, colour = "black"),
    axis.ticks = element_line(colour = "black", linewidth = 0.3),
    legend.position = "none",
    plot.title = element_text(face = "bold", size = 9.5, hjust = 0.5),
    plot.margin = margin(8, 4, 4, 4)
  )

runtime_memory <- runtime_memory |>
  mutate(Method = factor(Method, levels = method_order))

time_breaks <- c(10, 30, 60, 300, 600, 1800, 3600, 7200, 14400, 28800)
time_labels <- c("10 s", "30 s", "1 min", "5 min", "10 min", "30 min", "1 h", "2 h", "4 h", "8 h")

mem_breaks <- c(512, 1024, 4096, 8192, 16384, 32768, 65536, 262144)
mem_labels <- c("512 MB", "1 GB", "4 GB", "8 GB", "16 GB", "32 GB", "64 GB", "256 GB")

cell_breaks <- c(250, 500, 1000, 2000, 5000, 10000)
peak_breaks <- c(35000, 50000, 70000, 100000)
Complete Benchmark Set
Runtime and Peak RAM
Show code
p_runtime <- ggplot(df_friedman, aes(x = Method, y = RunTime_sec, fill = Method)) +
  geom_boxplot(
    outlier.shape = NA,
    width = 0.72,
    alpha = 0.82,
    linewidth = 0.35
  ) +
  geom_jitter(
    aes(color = Method),
    width = 0.14,
    size = 1.6,
    alpha = 0.55,
    show.legend = FALSE
  ) +
  scale_fill_manual(values = method_cols, drop = FALSE) +
  scale_colour_manual(values = method_cols, drop = FALSE) +
  scale_x_discrete(labels = method_labels, drop = FALSE) +
  scale_y_log10(breaks = time_breaks, labels = time_labels) +
  labs(title = "Run Time", x = NULL, y = "Run time") +
  coord_cartesian(clip = "off") +
  pub_theme +
  theme(
    axis.text.x = element_text(
      size = 8,
      face = "bold",
      angle = 35,
      hjust = 1,
      lineheight = 0.8
    )
  )

p_ram <- ggplot(df_friedman, aes(x = Method, y = PeakRAM_Mb, fill = Method)) +
  geom_boxplot(
    outlier.shape = NA,
    width = 0.72,
    alpha = 0.82,
    linewidth = 0.35
  ) +
  geom_jitter(
    aes(color = Method),
    width = 0.14,
    size = 1.6,
    alpha = 0.55,
    show.legend = FALSE
  ) +
  scale_fill_manual(values = method_cols, drop = FALSE) +
  scale_colour_manual(values = method_cols, drop = FALSE) +
  scale_x_discrete(labels = method_labels, drop = FALSE) +
  scale_y_log10(breaks = mem_breaks, labels = mem_labels) +
  labs(title = "Peak RAM", x = NULL, y = "Peak RAM") +
  coord_cartesian(clip = "off") +
  pub_theme +
  theme(
    axis.text.x = element_text(
      size = 8,
      face = "bold",
      angle = 35,
      hjust = 1,
      lineheight = 0.8
    )
  )

fig_box <- (p_runtime | p_ram) +
  plot_annotation(tag_levels = "a")

fig_box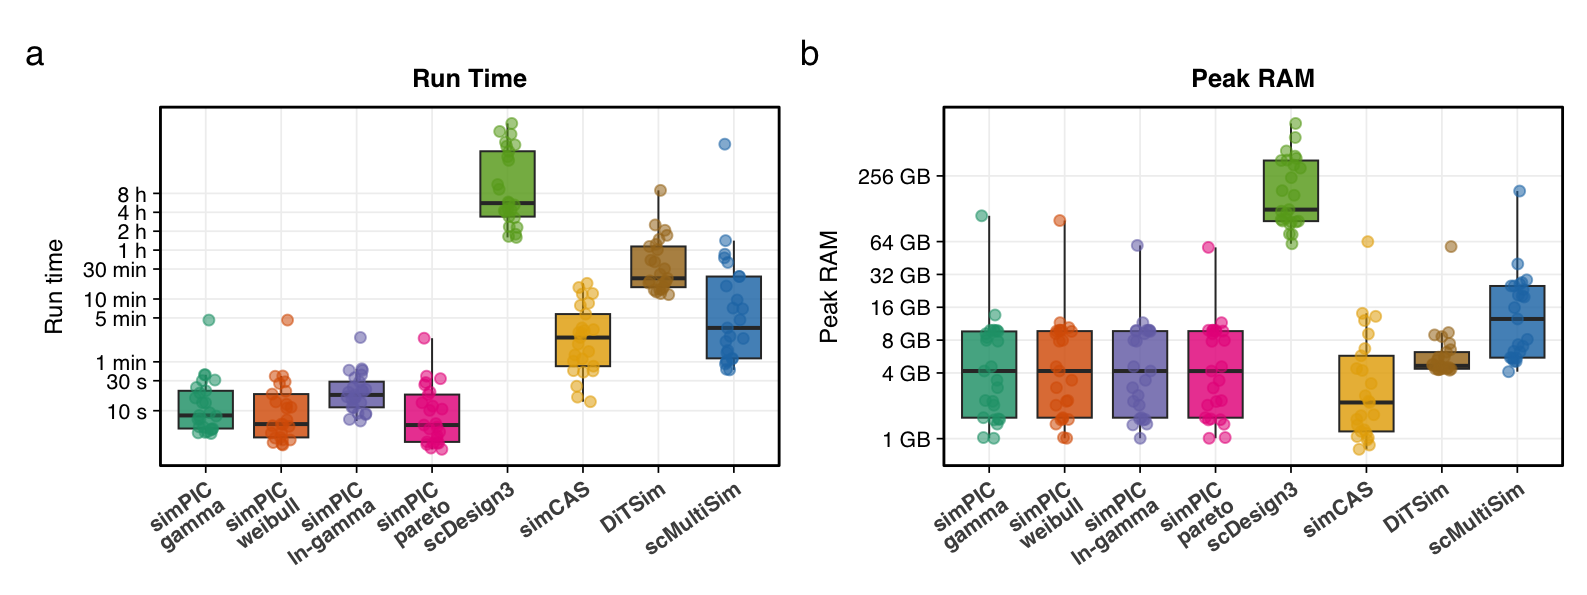
Scaling Relationships
Show code
make_scaling_plot <- function(data, xvar, yvar, xlab, ylab,
                              x_breaks = NULL, y_breaks = NULL, y_labels = waiver()) {
  p <- ggplot(
    data,
    aes(x = .data[[xvar]], y = .data[[yvar]], colour = Method)
  ) +
    geom_point(alpha = 0.28, size = 1.7, stroke = 0) +
    geom_smooth(method = "lm", formula = y ~ x, se = FALSE, linewidth = 1) +
    scale_colour_manual(
      values = method_cols,
      labels = method_labels,
      drop = FALSE
    ) +
    labs(x = xlab, y = ylab, colour = NULL) +
    coord_cartesian(clip = "off") +
    pub_theme +
    theme(
      legend.position = "bottom",
      legend.box = "horizontal",
      plot.margin = margin(8, 22, 8, 8)
    )

  if (is.null(x_breaks)) {
    p <- p + scale_x_log10(breaks = breaks_log(n = 5), labels = label_comma())
  } else {
    p <- p + scale_x_log10(breaks = x_breaks, labels = label_comma())
  }

  if (is.null(y_breaks)) {
    p <- p + scale_y_log10(breaks = breaks_log(n = 5), labels = label_comma())
  } else {
    p <- p + scale_y_log10(breaks = y_breaks, labels = y_labels)
  }

  p
}

p_npeaks_runtime <- make_scaling_plot(
  data = df_friedman,
  xvar = "nPeaks",
  yvar = "RunTime_sec",
  xlab = "Number of peaks",
  ylab = "Run time",
  x_breaks = peak_breaks,
  y_breaks = time_breaks,
  y_labels = time_labels
)

p_ncells_runtime <- make_scaling_plot(
  data = df_friedman,
  xvar = "nCells",
  yvar = "RunTime_sec",
  xlab = "Number of cells",
  ylab = "Run time",
  x_breaks = cell_breaks,
  y_breaks = time_breaks,
  y_labels = time_labels
)

p_npeaks_ram <- make_scaling_plot(
  data = df_friedman,
  xvar = "nPeaks",
  yvar = "PeakRAM_Mb",
  xlab = "Number of peaks",
  ylab = "Peak RAM",
  x_breaks = peak_breaks,
  y_breaks = mem_breaks,
  y_labels = mem_labels
)

p_ncells_ram <- make_scaling_plot(
  data = df_friedman,
  xvar = "nCells",
  yvar = "PeakRAM_Mb",
  xlab = "Number of cells",
  ylab = "Peak RAM",
  x_breaks = cell_breaks,
  y_breaks = mem_breaks,
  y_labels = mem_labels
)

p_npeaks_runtime <- p_npeaks_runtime + theme(legend.position = "none")
p_npeaks_ram <- p_npeaks_ram + theme(legend.position = "none")
p_ncells_runtime <- p_ncells_runtime + theme(legend.position = "none")

fig_rel <- (p_npeaks_runtime | p_npeaks_ram) /
  (p_ncells_runtime | p_ncells_ram)

fig_rel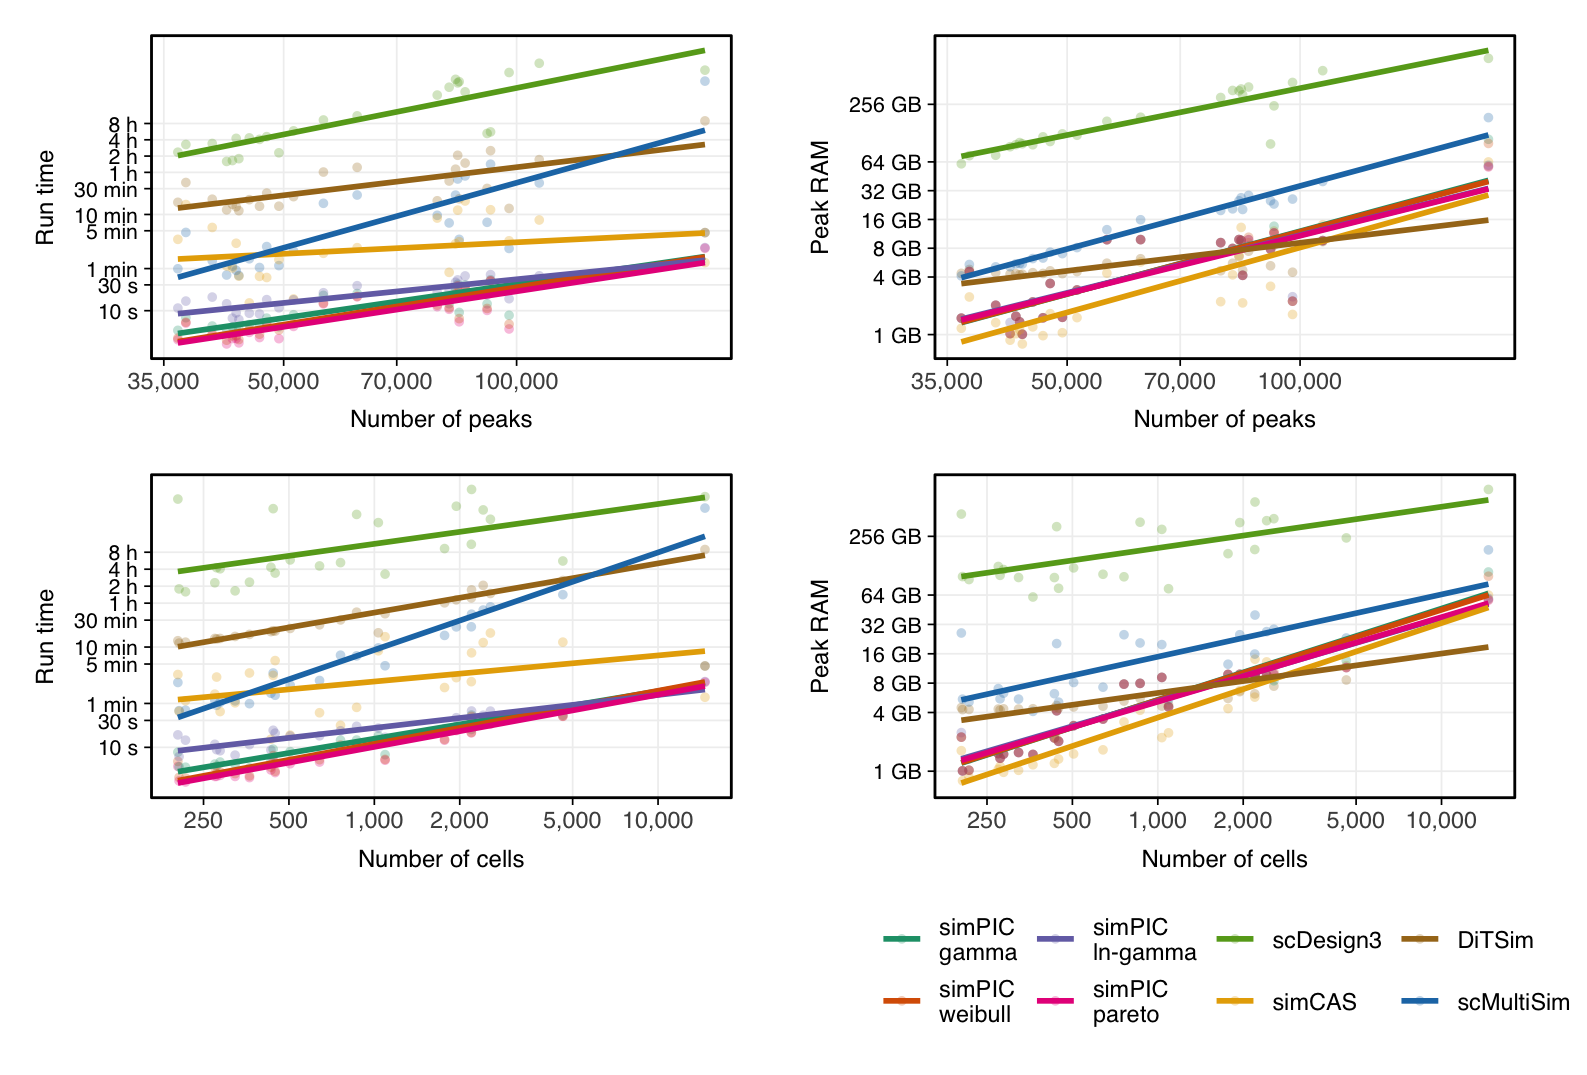
Combined Manuscript Figure
Show code
combined_fig <- fig_box / fig_rel +
  plot_layout(heights = c(0.65, 1.35)) +
  plot_annotation(tag_levels = "a")

combined_fig